

Colorectal cancer incorporates ICD-10 cancer codes C18 (Malignant neoplasm of colon), C19 (Malignant neoplasm of rectosigmoid junction) and C20 (Malignant neoplasm of the rectum).
Estimated number of new cases of colorectal cancer diagnosed in 2017
16,682 =  9,127 males +
  7,555 females
Estimated % of all new cancer cases diagnosed in 2017
12.4% 
Estimated number of deaths from colorectal cancer in 2017
4,114 = 2,136 males + 1,978 females
Estimated % of all deaths from cancer in 2017
8.6% 
Chance of surviving at least 5 years (2009–2013)
69%
People living with colorectal cancer at the end of 2012 (diagnosed in the 5 year period 2008 to 2012)
52,630
New cases of colorectal cancer
Colorectal cancer was the third most commonly diagnosed cancer in Australia in 2013. It is estimated that it will become the second most commonly diagnosed cancer in 2017 (Table 1). This is because the incidence of prostate cancer (which was the most commonly diagnosed cancer in 2013) is expected to continue to decline.
In 2013, there were 14,962 new cases of colorectal cancer diagnosed in Australia (8,214 males and 6,748 females). In 2017, it is estimated that 16,682 new cases of colorectal cancer will be diagnosed in Australia (9,127 males and 7,555 females).
In 2013, the age–standardised incidence rate was 58 cases per 100,000 persons (68 for males and 49 for females). In 2017, it is estimated that the age–standardised incidence rate will remain at 58 cases per 100,000 persons (67 for males and 49 for females). The incidence rate of colorectal cancer is expected to generally increase with age for both males and females (Figure 1).
In 2017, it is estimated that the risk of an individual being diagnosed with colorectal cancer by their 85th birthday will be 1 in 13 (1 in 11 males and 1 in 15 females).
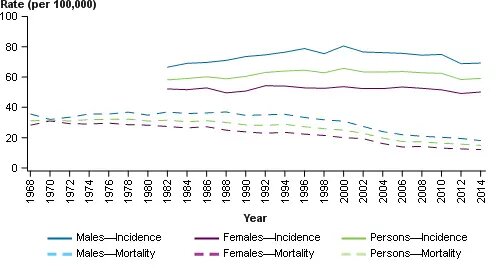
The number of new cases of colorectal cancer diagnosed increased from 6,986 (3,524 males and 3,462 females) in 1982 to 14,962 in 2013. Over the same period, the age–standardised incidence rate increased steadily from 58 cases per 100,000 persons (67 for males and 52 for females) in 1982 to a peak of 66 cases per 100,000 (81 for males and 55 for females) in 2000 and 2001 before decreasing to 58 cases per 100,000 in 2013 (Figure 2).
| Cancer type | New cases 2017 | % of all new cancers 2017 |
|---|---|---|
| Breast | 17,730 | 13.2 |
| Breast (among females) | 17,586 | 28.4 |
| Colorectal (bowel) | 16,682 | 12.4 |
| Prostate (among males) | 16,665 | 23.1 |
| Melanoma | 13,941 | 10.4 |
| Lung | 12,434 | 9.3 |
Deaths from colorectal cancer
In 2014, colorectal cancer was the second leading cause of cancer deaths in Australia. It is estimated that it will remain the second most common cause of death from cancer in 2017 (Table 2).
In 2014, there were 4,071 deaths from colorectal cancer in Australia (2,236 males and 1,835 females). In 2017, it is estimated that this will increase to 4,114 deaths (2,136 males and 1,978 females).
In 2014, the age–standardised mortality rate was 15 deaths per 100,000 persons (18 for males and 12 for females). In 2017, it is estimated that the age–standardised mortality rate will be 14 deaths per 100,000 persons (16 for males and 12 for females). The mortality rate of colorectal cancer will generally increase with age (Figure 1).
In 2017, it is estimated that the risk of an individual dying from colorectal cancer by their 85th birthday will be 1 in 54 (1 in 47 males and 1 in 63 females).
The number of deaths from colorectal cancer increased from 2,500 (1,218 males and 1,282 females) in 1968 to 4,071 in 2014. Over the same period, the age–standardised mortality rate decreased from 31 deaths per 100,000 persons (36 for males and 28 for females) in 1968 to 15 deaths per 100,000 in 2014 (Figure 2).
| Cancer type | Number of deaths 2017 | % of all cancer deaths 2017 |
|---|---|---|
| Lung | 9,021 | 18.9 |
| Colorectal (bowel) | 4,114 | 8.6 |
| Prostate (among males) | 3,452 | 12.7 |
| Breast | 3,114 | 6.5 |
| Breast (among females) | 3,087 | 14.9 |
| Pancreatic | 2,915 | 6.1 |
Figure 1: Estimated age-specific incidence and mortality rates for colorectal cancer, by sex, 2017
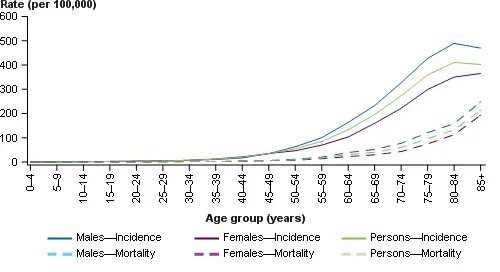
Figure 2: Age-standardised incidence rates for colorectal cancer 1982–2013 and age-standardised mortality rates for colorectal cancer 1968–2014, by sex
Survival from colorectal cancer
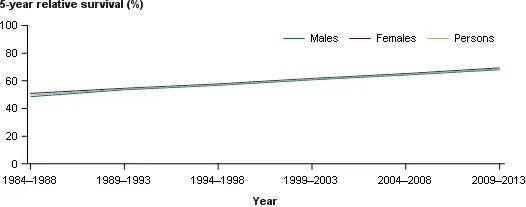
In 2009–2013, individuals diagnosed with colorectal cancer had a 69% chance (68% for males and 69% for females) of surviving for 5 years compared to their counterparts in the general Australian population.
Between 1984–1988 and 2009–2013, 5-year relative survival from colorectal cancer improved from 50% to 69%.
Figure 3: 5-year relative survival from bowel cancer, 1984–1988 to 2009–2013
Survivorship population for colorectal cancer
The survivorship population is measured using prevalence data. Prevalence refers to the number of people alive who have previously been diagnosed with colorectal cancer.
The prevalence for 1, 5 and 31 years given below are the number of people living with colorectal cancer at the end of 2012 who had been diagnosed in the preceding 1, 5 and 31 years respectively.
At the end of 2012, there were 13,078 people living who had been diagnosed with colorectal cancer that year, 52,630 people who had been diagnosed with colorectal cancer in the previous 5 years (from 2008 to 2012) and 129,497 people who had been diagnosed with colorectal cancer in the previous 31 years (from 1982 to 2012).
Data notes
International Statistical Classification of Diseases and Related Health Problems Version 10 (ICD–10)
Cancer is classified by the International Statistical Classification of Diseases and Related Health Problems Version 10 (ICD–10). This is a statistical classification, published by the World Health Organization, in which each morbid condition is assigned a unique code according to established criteria.
Estimations
Future estimations for incidence and mortality are a mathematical extrapolation of past trends. They assume that the most recent trends will continue into the future, and are intended to illustrate future changes that might reasonably be expected to occur if the stated assumptions continue to apply over the estimated period. Actual future cancer incidence and mortality rates may vary from these estimations. For instance, new screening programs may increase the detection of new cancer cases; new vaccination programs may decrease the risk of developing cancer; and improvements in treatment options may decrease mortality rates.
Incidence
Cancer incidence indicates the number of new cancers diagnosed during a specified time period (usually one year).
The 2013 national incidence counts include estimates for NSW because the actual data were not available. Note that actual data for the Australian Capital Territory do not include cases identified from death certificates.
The 2017 estimates are based on 2004–13 incidence data. Due to rounding of these estimates, male and female incidence may not sum to person incidence.
Mortality
Cancer mortality refers to the number of deaths occurring during a specified time period (usually one year) for which the underlying cause of death is cancer.
The 2017 estimates are based on mortality data up to 2013. Joinpoint analysis was used on the longest time series of age–standardised rates available to determine the starting year of the most recent trend.
Prevalence
Prevalence of cancer refers to the number of people alive with a prior diagnosis of cancer at a given time. It is distinct from incidence, which is the number of new cancers diagnosed within a given period of time. The longest period for which it is possible to calculate prevalence using the available national data (from 1982 to 2012) is currently 31 years so this is used to provide an estimate of the ‘total’ prevalence of cancer as at the end of 2012, noting that people diagnosed with cancer before 1982 aren’t included.
Age standardised rates
Incidence and mortality rates expressed per 100,000 population are age–standardised to the Australian population as at 30 June 2001.
References
- Australian Institute of Health and Welfare 2017. Australian Cancer Incidence and Mortality (ACIM) books: Colorectal cancer. Canberra: AIHW. www.aihw.gov.au/acim-books.
- AIHW 2017. Cancer in Australia 2017. Cancer series no. 101. Cat. No. CAN 100. Canberra: AIHW.